The Position of the European Union in the Business Cycle Before & After the Global Financial Crisis and Relevant Economic Policies
05 June 2017 on blog. 21 minutes
This is the research project for the Illinois-Austria (Vienna) Study Abroad Program in Summer 2017, with the course name “European Union and Globalization”.
1 Introduction and Research Summary
-
The European Union, tracing its origins from the European Coal and Steel Community (ECSC, Treat of Paris, 1951) and the European Economic Community (EEC, Treaties of Rome, 1957), was established in 1993 by the Maastricht Treaty and introduced European citizenship. With the primary aim to integrate European countries, the European Union works hard on three main goals: no more wars, gain strength through economic cooperation, and make contributions to global humanist society. Starting with the six founding members (Belgium, Luxembourg, Netherlands, Italy, Germany, France), the European Union now has 28 member states.
-
To converge the economies of the member states and thus accelerate EU integration, the Economic and Monetary Union (EMU) was launched in 1992. The EMU involves the coordination of economic and fiscal policies, a common monetary policy and a common currency, the euro. On January 1, 2002, the euro replaced the old currencies of 12 European Union countries, which together made up the Eurozone, and now there are 19 member states in the Eurozone. The policies made by the EMU cover the 19 Eurozone states, which adopt the euro as the common currency, as well as some non-Euro European Union states.
-
Because of its successful and sustainable economic integration, the European Union member states closely bind together and meanwhile, they will expectedly stand and fall as a whole when faced with financial crisis, even though each of the member states could have its individual financial problems. The global financial crisis, caused by the US subprime mortgage crisis, strongly hit the European economy: falling growth rates, rising unemployment rates, and rapidly increasing public deficits and debts. European bank assets have shrunk dramatically with huge losses, the bank’s profitability reduced and so the financial industry was faced with big fluctuations. To minimize the losses associated with the crisis to national banks, there was a main trend of reorganization, mergers, and nationalization among European banks, aiming to increase bank competitiveness by expanding the scale. The crisis also had far-reaching social and political influence, including the resignation of government officers in some of the European countries heavily hit by the crisis.
-
This project applies the knowledge in European Union economic and financial systems and policy making systems to analyze where the European Union was in the business cycle before and after the global financial crisis and how EU fiscal and monetary policies are intended to lead it out ofthe crisis.
-
Why does the position of the European Union in the business cycle matter? By definition, the business cycle is the downward and upward movement of gross domestic product (GDP) around its long-term growth trend. The process mainly includes expansion, an “economic recovery” period, and recession, a declining period. Figure 1 attached illustrates the business cycle pattern. When a country or economic system starts in the cycle, according to Figure 1, the economy is expected to go through four periods, which are expansion, peak, contraction and trough. During the expansion phases, GDP rises and unemployment rate decreases; while in periods of recession, GDP declines and unemployment rate goes up. Once we get to know where European Union is in the business cycle, we will be able to see what its economic growth looks like, how the global financial crisis influences the growth, how fiscal and monetary policies help to improve the situation and recover from recessions, and what the future trend could be.
-
We mainly focus on the following questions for the analysis:
-
Why was the European Union heavily influenced by the financial crisis originated in the US?
-
In what aspects did the crisis change the structure of the European economic system?
-
How did the European Union respond to the 2008 crisis and how do those fiscal and monetary policies influence and develop the European economy?
-
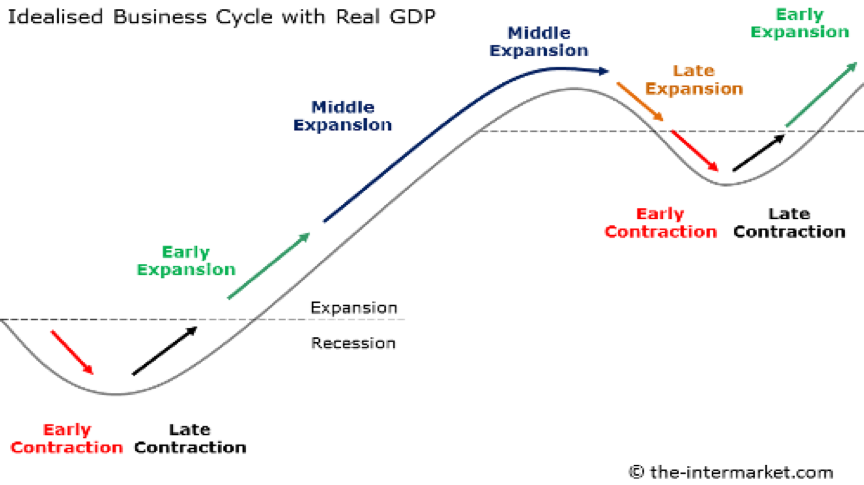
Figure 1: Business Cycle
2 Global Financial Crisis and Its Impacts on European Union Countries
- In this section, we will gather data in graphs and charts on key macroeconomic indicators and use the data to analyze how the European economy behaves in a specific period of time. We first outline the context within which the global financial crisis started and expanded to influence European economics. Then we consider the root of the crisis and the change in status of the European economy, together with indicators which illustrate the economic conditions and fluctuations in the European Union.
2.1 Background of the Global Financial Crisis
-
In the second half of 2007, the US subprime mortgage crisis triggered the Wall Street crisis, and then led to the global financial crisis. The subprime mortgage crisis was caused by a large decline in home prices after the collapse of a housing bubble, when the market price of housing rapidly increases, strongly exceeding its intrinsic value, and then declines in a bubble. The housing bubble led to mortgage delinquencies, foreclosures, and the devaluation of housing-related securities, resulting in declines in residential investment, reductions in household spending and business investment. (Mortgage delinquencies: a home loan for which the borrower has failed to make payments as required; Foreclosures: a homeowner is unable to make full principal and interest payments on mortgage, which allows the lender to seize the property, evict the homeowner and sell the home.)
-
This crisis in the subprime mortgage market in the US then developed into a full-blown international bank crisis with the collapse of the investment bank Lehman Brothers on September 15, 2008, and started to influence the world financial system. The European debt crisis, which was a crisis in the banking system of European countries using the euro, came later. (“European Debt Crisis”, Wikipedia)
2.2 Global Financial Crisis Impacts on the European Union Economy
-
The subprime mortgage crisis was due to the US subprime mortgage loans. To raise cash by collecting money from other investors, these loans had been continuously converted into marketable securities, leading to the formation of financial derivative products, including residential mortgage-backed security (RMBS), collateralized debt obligation (CDO), and credit default swap (CDS). These innovative financial bonds are characterized by high returns, high risk, and unlimited risk transfer, and thus favored by European banks and investment funds. Since European banks held a large amount of US subprime mortgage securities, the financial crisis first hit the European financial industry. Credit started to tighten, leading to a serious shortage of the flow of capital, and eventually implicating almost all major European banks and insurance companies.
-
Here we start the analysis in detail of the European Union’s status change in the business cycle by considering three economic indicators: GDP, unemployment rate and inflation rate.
2.2.1 First indicator: GDP per Capita and GDP growth
- In order to analyze where the European Union was in the business cycle before the financial crisis, we first look at the European Union per capita GDP in a 10-year period, from year 2002 to 2012, including the time when the global financial crisis started and expanded. Given the data from the World Bank, we use the python code to visualize the per capita GDP amounts with a bar chart. From Figure 2 we see that the European Union per capita GDP kept increasing in 2002 – 2008, with the value rising from 20006 USD to 38097 USD. Due to the strong impacts of the global financial crisis in 2008, and after a reaction lag, the per capita GDP dropped to 33935 USD by 2009 and kept declining to 33659 USD by 2010. After the severe shock of the crisis, the per capita GDP rose back to 36388 USD.
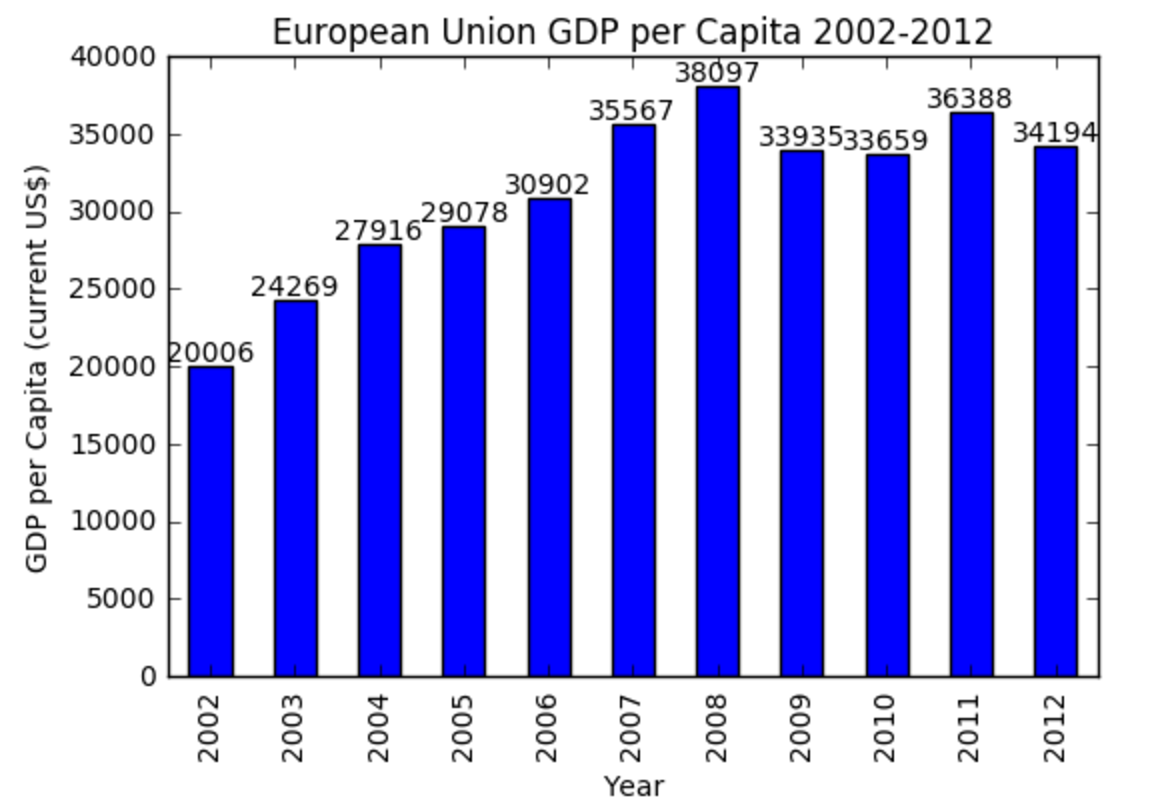
Figure 2: European Union GDP per Capita 2002 - 2012
- To see the trend of change in European GDP in this 10-year period, we use Figure 3, the graph of European Union GDP per Capita Growth Rate (annual %) to illustrate it.
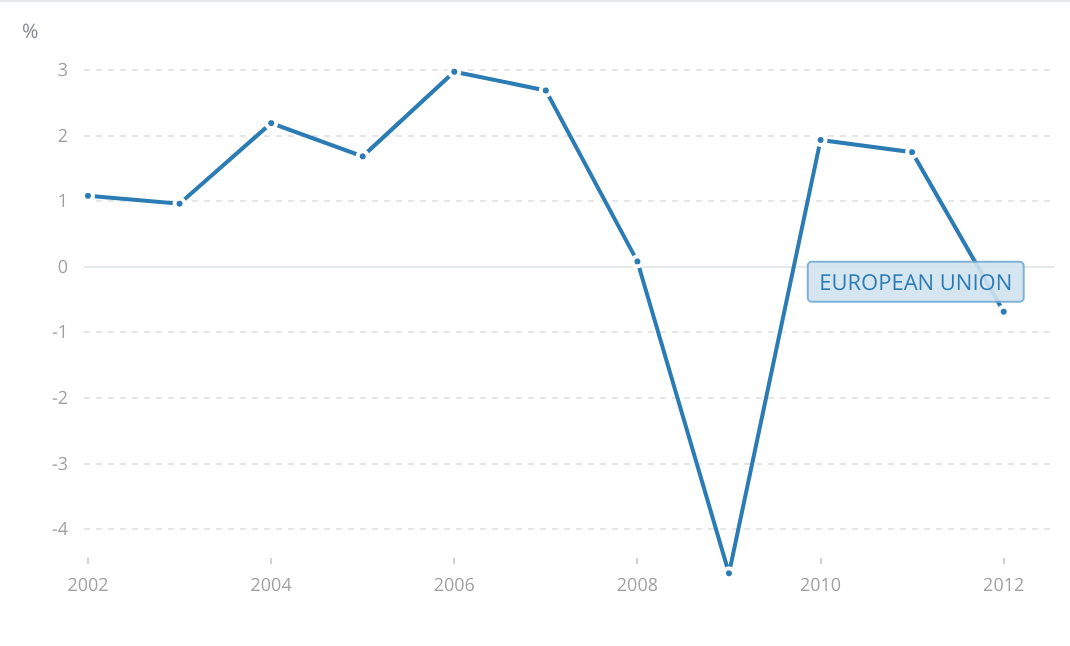
Figure 3: GDP per Capita Growth Rate 2002 – 2012 (annual %)
- Here we see that from 2002 to 2012, the European Union GDP growth rate is mostly higher than 0, in a positive rate, which means that the GDP was increasing in most periods of this 10-year period. There was a trough around 2009, where the European Union GDP growth rate severely dropped down to -4.67%, strongly influencing the overall European economic situation in the following years. The average growth rate is below 1.5% (1.08%), even though the growth rate in many parts of the period is higher than 1.5%. We can tell that the horrible economic situation caused by the financial crisis in 2008 negatively changed the process in the business cycle and left behind serious problems that urgently need to be solved in the following years.
2.2.2 Second Indicator: Unemployment Rate
- Then we look at the second indicator – the unemployment rate. We use the data from the Eurostat to see how unemployment rate behaved in this 10-year period and what it suggests about where the European Union is in the business cycle.
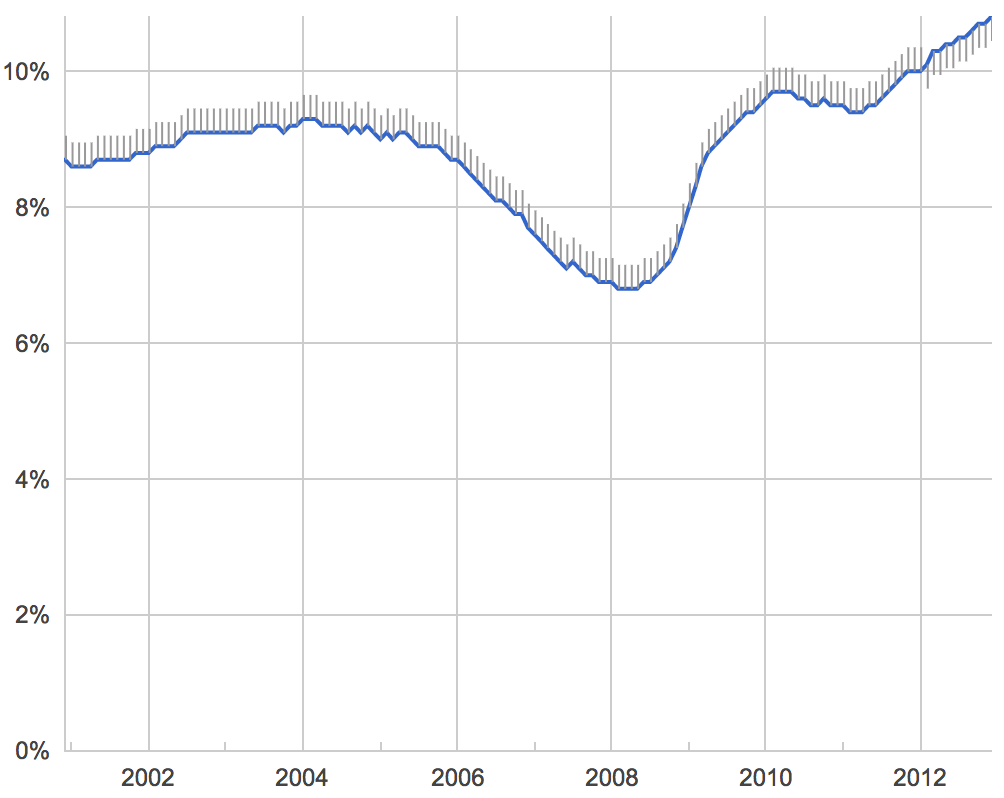
Figure 4: Unemployment Rate in European Union 2002 – 2012
- According to Figure 4, the unemployment rate remainedfairly steady at around 9.2% from year 2002 to 2006. Then it steadily followed a downward path, corresponding to the steady rise of GDP in 2002 – 2006 and lasting until the first quarter of 2008, when the unemployment rate reached a low value of 6.8% (16.2 million persons) before rising sharply in the wake of the financial crisis. Between the first quarter of 2008 and the second quarter of 2010, the European Union unemployment rose by 6.9 million persons, and we can see from Figure 4 that the unemployment rate jumped up to 9.7%. Such a high unemployment rate was relatively unchanged in the following year, even though this was a false sign as increased stability in the labor market and at the end of crisis. Ironically, the unchanged unemployment rate indicates an end of the crisis, but the rate was stable at a high point which refers to a long-lasting impact of the crisis.
2.2.3 Third Indicator: Inflation Rate
- The third indicator – inflation rate indicates the general change in price level from 2002 to 2012. The inflation rate data are based on the change in unadjusted Consumer Price Index (CPI), a measure that examines the weighted average of prices in a basket of consumer goods and services, such as transportation, food and medical care.
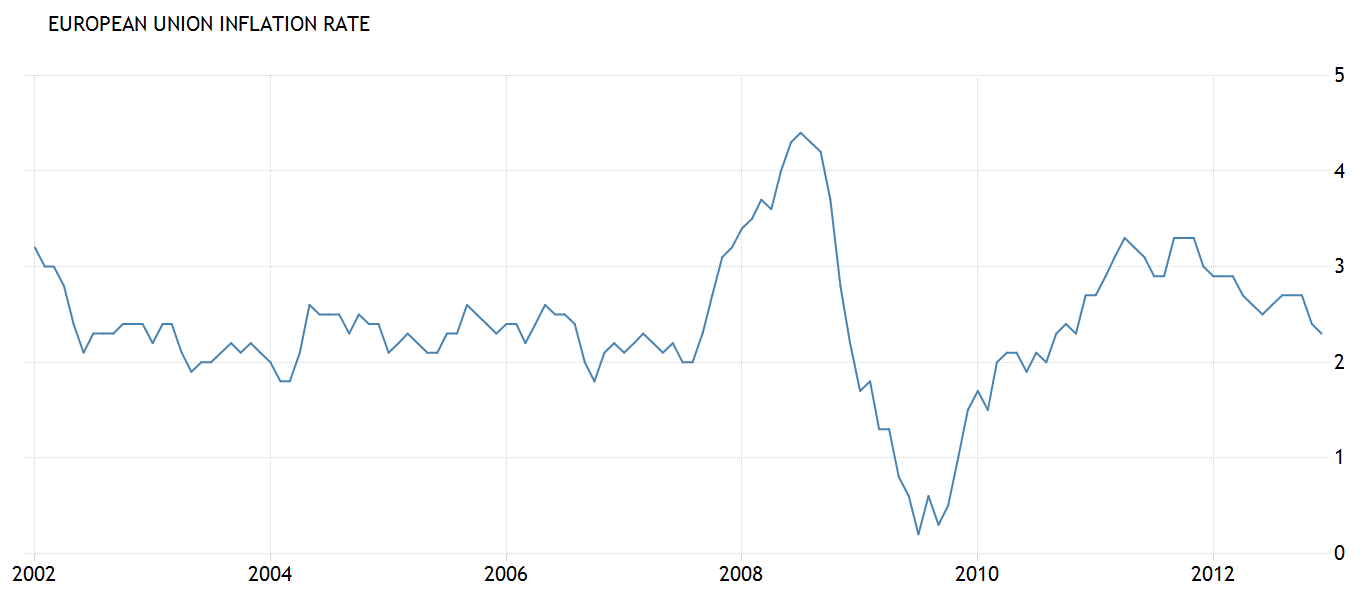
Figure 5: Inflation Rate in European Union 2002 – 2012
- From Figure 5, the graph of inflation rate in European Union, we see an obvious rise from the second quarter of 2007 to the second quarter of 2008, with a peak at 4.4% and then a rapid decline to 0.3% in the second quarter of 2009.
2.2.4 Analysis on Business Cycle with all three indicators above
- Combining the GDP data, unemployment rate and inflation rate, we can summarize by cutting the 10-year period into four parts: in 2002 – 2006, GDP increased, unemployment rate kept steady, and inflation rate fluctuated; in 2006 – 2008, GDP increased more to reach a peak, unemployment rate declined to reach a lowest value within 10 years and inflation rate obviously increased; in 2008 – 2010, GDP severely declined, unemployment rate jumped significantly, and inflation rate rapidly decreased; in 2010 – 2012, all three indicators fluctuated and tended to be steady. According to the data of these three indicators, we could tell that the European Union was in a steady period in 2002 – 2006, and was in expansion in 2006 – 2008, and rapidly dropped into recession in 2008 – 2010 influenced by the global financial crisis, and then fluctuated to reform and recover from the recession.
3 How the European Union Reacted to Financial Crisis and Policy Impacts
- Since the global financial crisis has widely influenced the European Union economy in aspects of GDP, unemployment rate and inflation rate, the European Union must take action to deal with the recession and restore the financial system. In this section, we mainly focus on the following questions: who makes economic policies for European Union and what are the goals; how much money does it spend and what projects are in place to enable recovery from crisis, and how do the policies influence the European Union economy? We will go back to the analysis in section 2.2 again to see how the fiscal and monetary policies made by the European Union governments changed the economic status in the business cycle after the global financial crisis.
3.1 Who makes economic policies in EU and what are the goals?
-
As stated in the introduction, the Economic and Monetary Union (EMU) involves the coordination of economic, fiscal and monetary policies. Within EMU there is no single institution responsible for making economic policy. The responsibility is instead shared by the member states and EU institutions: the European Council sets the main policy orientation, the Council coordinates economic policy-making, the “Eurogroup” coordinates policies of common interest for the euro-area, the member states set their national budgets and determine their own structural policies, the European Commission monitors performance and compliance, the European Central Bank (ECB) sets monetary policy and the European Parliament formulates legislation with the Council.
-
Since the financial and economic crisis began in 2008, the European Central Bank (ECB) and the Commission have worked together with the goals to restore financial stability for economic growth and job creation, protect savings, maintain a flow of affordable credit and improve into a better EU system of economic and financial governance.
3.2 Money Spent and Main Tools
-
To prevent disruptions to the banking system, many EU governments urgently supported their banks on an unprecedented scale. Between 2008 and 2011, according to EU economic and monetary affairs, the governments spent 1.6 trillion Euro – equivalent to 13% of EU’s annual GDP – into the banking system through guarantees or direct capital. (“Economic and Monetary Affairs.” European Union)
-
In political aspects, the European Union also set up the European Stability Mechanism (ESM), the world’s largest multilateral financial institution, with an effective lending capacity of up to 500 billion Euro. The ESM is a safety net for the Eurozone countries, which helps to maintain the financial stability. Moreover, the EU introduced stronger rules between 2011 and 2013 to keep a tighter check on public debt and deficits, ensuring that governments do not spend beyond their means.
3.3 Government Policies’ Impacts
- To restore financial stability and stimulate economic growth after the crisis, the European Union governments used expansionary fiscal policy to increase the spending on banking system in form of direct capital. Meanwhile, given the data from European Central Bank, shown in Figure 6, we can tell that the money supply M1 (circulation of notes and coins) obviously increased since late 2008 and continued the upward trend, which indicated usage of expansionary monetary policy.
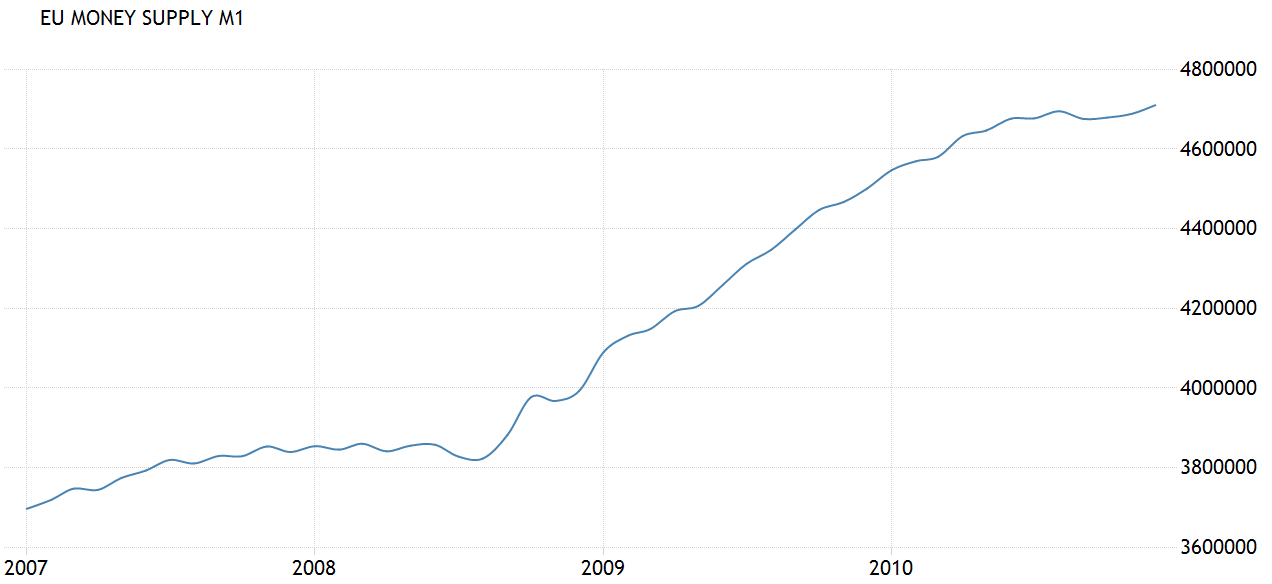
Figure 6: EU Money Supply M1 2007 – 2010
3.3.1 Fiscal Policies and Impacts
-
Since the EU governments were increasing money spent in the banking system, which can be generally treated as an increase in government spending (G), and output Y (Aggregate Expenditure) = C (Consumption) + I (Investment) + G (Government Spending), once G goes up, Y goes up, as shown in Figure 7.
-
However, there is a crowding-out effect displayed in Figure 8, 9, 10. As GDP goes up, there will be an increase in the money demand (Md) within the money market (Figure 8), shifting the money demand curve to the right. Following this increase in money demand, the interest rate (r) will rise (Figure 8), and so there will be a crowding-out effect, where the private investment (I) decreases when r goes higher (Figure 9). The reason is that when the interest rate rises, it becomes costly to borrow money from banks such that fewer investment projects are likely to be undertaken. Then, this reduction in private investment spending leads to a reduction in the output (Income Y). Since Y=C+I+G, if I decreases, then Y decreases.
-
As shown in Figure 10, Y1 at first goes to Y3 due to the increase in government spending (G), and then Y3 goes lower to Y2 towards Y1 due to the crowding-out effect, a decrease in private investment (I). However, Y2 is still larger than Y1, the original output, which means that after the process, the increase in government expenditures has finally increased the output, stimulating the economic growth. This crowing-out effect could explain the fluctuations of economic indicators we have observed in part 2.2.


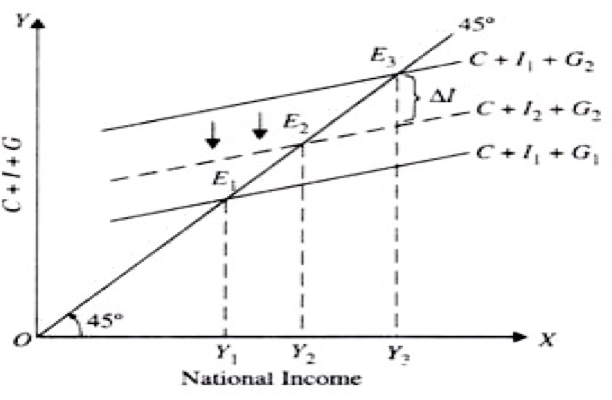
Figure 10: Crowding-out Effect
3.3.2 Monetary Policies and Impacts
- With the expansionary monetary policy, the money supply increases. According to Figure 11, the increase in money supply leads to a decrease in interest rate, encouraging investment to increase (by Figure 12), and as a result supporting the GDP to increase even more (Y=C+I+G). Then we have entered another turn of crowding-out circulation, which causes fluctuations.


4 Conclusion and Further Research Expectations
-
In this paper, we have talked about the formation of European Union and its economic system, and how has the global financial crisis (originating inthe US) influenced the European Union countries by looking into three main economic indicators: GDP, unemployment rate and inflation rate. We could generally tell that the European Union was in an expansion period in the business cycle before it was seriously hit by the global financial crisis, according to the trend of its growth rate. The European banks and investment funds favored innovative financial bonds with high risk and high returns, holding a large amount of US subprime mortgage securities, so when the subprime mortgage crisis exploded in the US, it directly hit the European Union countries, and dragged it down to a recession period in the business cycle.
-
Then we discussed the economic policy-making institutions and their functions in the Economic and Monetary Union. The institutions have their own main functions and work together to come up with policies and take the decisions into force. To deal with the recession caused by the global financial crisis, the European Union governments adopted an expansionary fiscal policy by increasing the government expenditures on restoring European banking systems through the form of guarantees or direct capital. In this way, the aggregate expenditures increased and created more job opportunities, and thus stimulating the economic growth in European Union. Moreover, according to the data provided by its official website, the European Central Bank used an expansionary monetary policy by increasing the money supply in money market, leading to a decrease in the interest rate and promoting private investment.
-
The effect of increased government spending in the money market, however, caused a crowding-out effect of private investment, and thus led to a drop in the overall output. This situation can result in an economic period with fluctuations, which corresponds to the economic recovery period of European Union right after the crisis quieted down.
-
When the European Union government strengthens its governance and policy making effectiveness, the utilization of a mix of expansionary fiscal policy and expansionary monetary policy helps the economic condition to reduce the long-lasting influence of global financial crisis. Based on the trend of economic indicators in European Union countries, we can assume that the recovery period will last for a while and then become more stable. First the economy needs to return to the normal condition before the crisis and then develop steadily more to a better situation, where GDP continues to increase while the unemployment rate declines.
-
To further this project, I would research more other countries and areas to see how the global financial crisis has impacted their economy and financial systems, where these countries were in the business cycle before and after the global financial crisis, what kind of policies do these countries’ governments used to deal with the recession, if occurred, and how these policies took effects and changed the country’s status in the business cycle again.
-
To make reasonable and effective economic policies, the European Union governments could conduct research like those mentioned above by comparing the European Union economy with those of other countries and areas. Then they could see what the similarities and differences are between their systems, and refer to others’ usage of policies to gain more practical ideas when making their own policies. Theoretically, the governments can actively change their status in business cycle by making good policies and thus minimize their losses from crisis.
5 Works Cited
[1] Fontaine, Pascal. “Europe in 12 Lessons Editions.” Editions of Europe in 12 Lessons by Pascal Fontaine. European Union Publications Office, Jan. 2014. Web. 14 May 2017.
[2] Idealized Business Cycle with Real GDP. Digital image. The-intermarket.com. N.p., 31 Mar. 2015. Web. 6 Apr. 2016.
[3] “Economic and Monetary Union.” European Commission. The European Commission, 21 Apr. 2017. Web. 01 June 2017.
[4] SERRICCHIO, FABIO, MYRTO TSAKATIKA, and LUCIA QUAGLIA. “Euroscepticism and the Global Financial Crisis.” JCMS: Journal of Common Market Studies. Blackwell Publishing Ltd, 07 Nov. 2012. Web. 01 June 2017.
[5] Zhang, Min. “Global Financial Crisis Influence European Economy and Reasons.” (2010): n. pag. 27 Jan. 2010. Web. 1 June 2017.
[6] “GDP (current US$).” The World Bank. Ed. World Bank National Accounts Data. World Bank Group, 2012. Web. 01 June 2017.
[7] “GDP per Capita Growth (annual %).” GDP per Capita Growth (annual %) Data. Ed. The World Bank. World Bank Group, 2012. Web. 01 June 2017.
[8] Eurostat. “Unemployment Rate.” Google. Google, 1 June 2017. Web. 01 June 2017. “Subprime Mortgage Crisis.” Wikipedia. Ed. Nick Moyes. Wikimedia Foundation, 29 May 2017. Web. 01 June 2017.
[9] Fontinelle, Amy. “Delinquent Mortgage.” Investopedia. Investopedia, 26 May 2016. Web. 01 June 2017.
[10] Fontinelle, Amy. “Foreclosure - FCL.” Investopedia. Investopedia, 27 Feb. 2017. Web. 01 June 2017.
[11] “Financial Crisis of 2007–2008.” Wikipedia. Ed. Raquel Baranow. Wikimedia Foundation, 31 May 2017. Web. 01 June 2017.
[12] “European Debt Crisis.” Wikipedia. Wikimedia Foundation, 05 June 2017. Web. 06 June 2017.
[13] Statistics Explained. “Unemployment Statistics and beyond.” Unemployment Statistics and beyond - Statistics Explained. Eurostat, 2015. Web. 01 June 2017.
[14] Anonymous. “Economic and Monetary Affairs.” European Union - European Commission. European Union, 14 Nov. 2016. Web. 02 June 2017.
[15] European Central Bank. “Euro Area Money Supply M1 1980-2017 / Data / Chart / Calendar / Forecast.” Euro Area Money Supply M1 / 1980-2017 / Data / Chart / Calendar / Forecast. Trading Economics, Apr. 2017. Web. 02 June 2017.
[16] Money Supply M1. Digital image. Trading Economics. Federal Reserve, Mar. 2016. Web. 2 June. 2017.
[17] Mankiw, N. Gregory. Principles of Economics. Boston, MA: Cengage Learning, 2018. Print.